
Postman + JsonGrid visualizations
Postman with Enhanced JSON Visualizations

For a while (a few years) I’ve used Insomnia as my favorite REST Tool. I’ve also looked with good eyes at Hoppscotch, but it being browser-based means that you need to go through a lot of hurdles for local development (and I’ve just never had the patience).
But being that everyone still uses Postman, I decided to switch back. It’s not about just following the majority, but ensuring that there’s an active community for the tools that I use. Also, I initially was scared of Postman becoming too close to force to sell paid plans, but the years proved me wrong. Finally, all the extra features I needed eventually made it there.
Postman visualizations
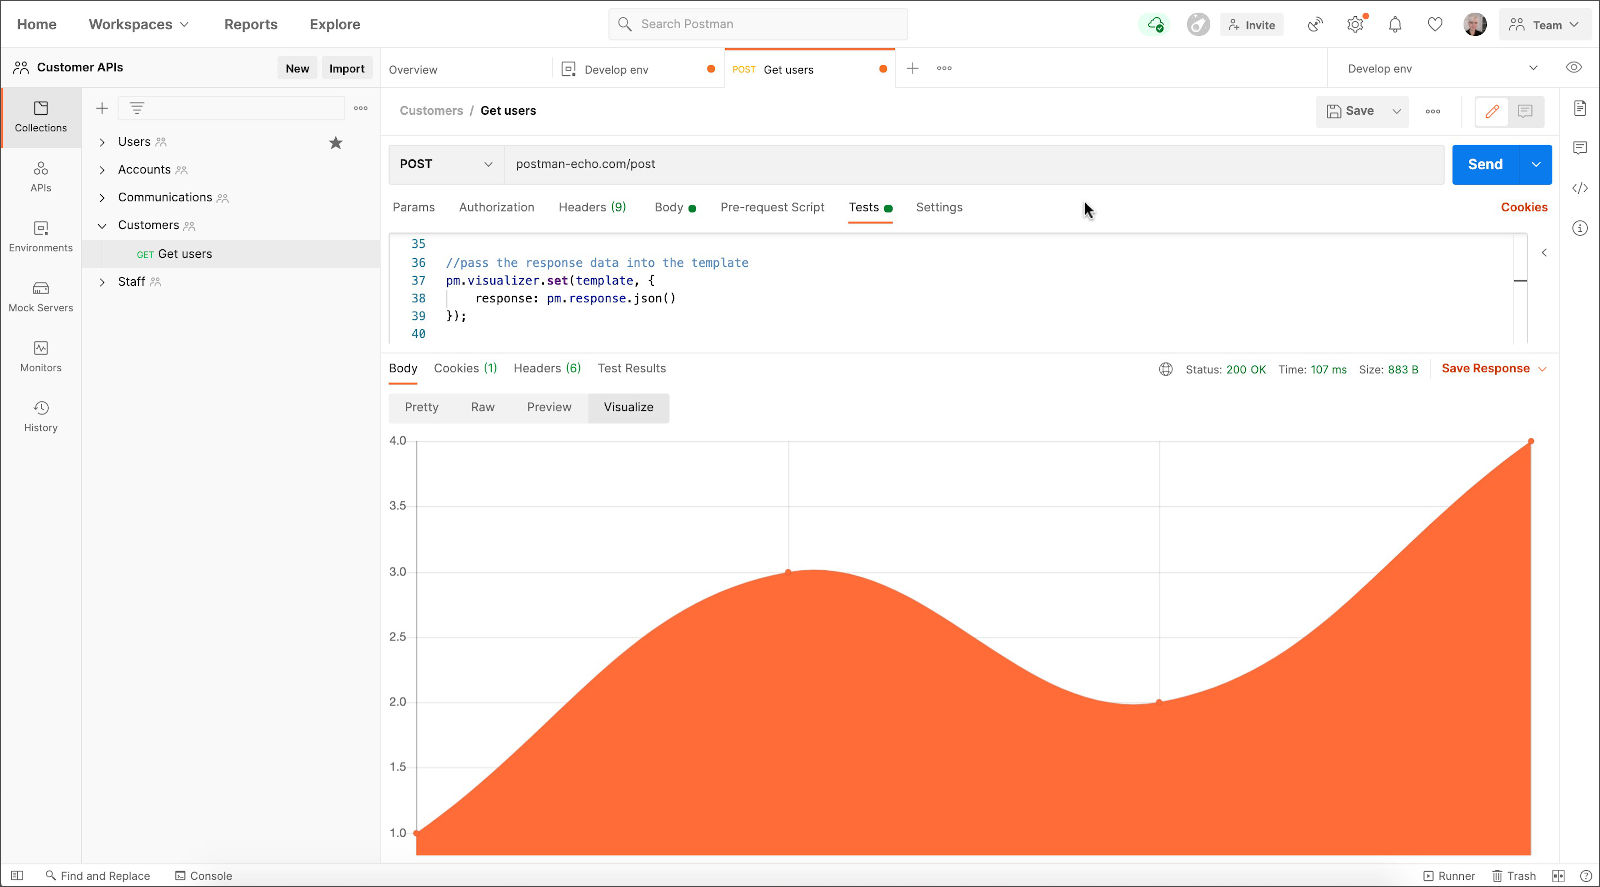
One of the things I absolutely loved about my return to Postman is the existence of the “Visualizations” feature. It’s a way to change the response with a custom script and render it in any fance way you’d like. I’m personally not a fan of it being mixed with the “Tests” feature, but it is what it is.
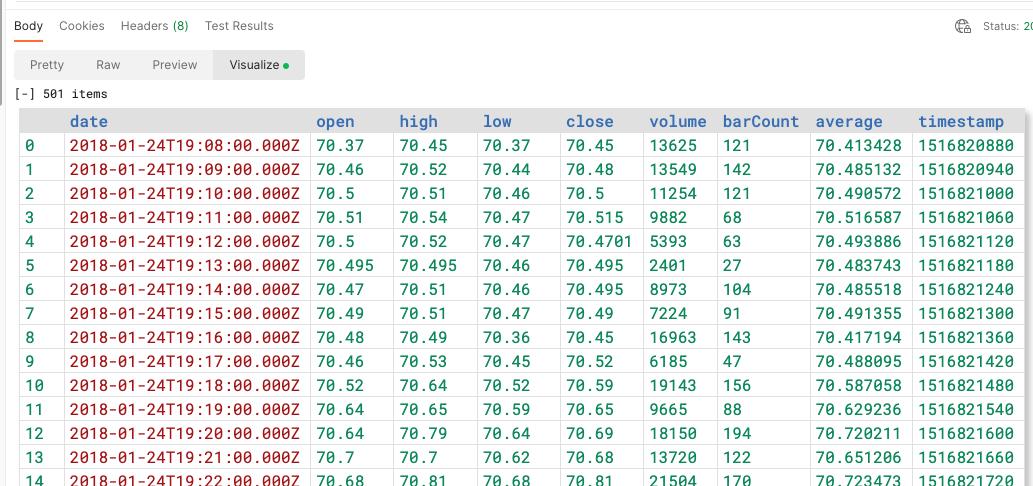
For JSON visualizations, the default prettifier is pretty good and pretty much what you’d expect. However, for responses where there are arrays of objects, it becomes very tiresome to go through each of them, when usually you’re looking for a particular value, or looking to compare the same value across different objects.
JsonGrid
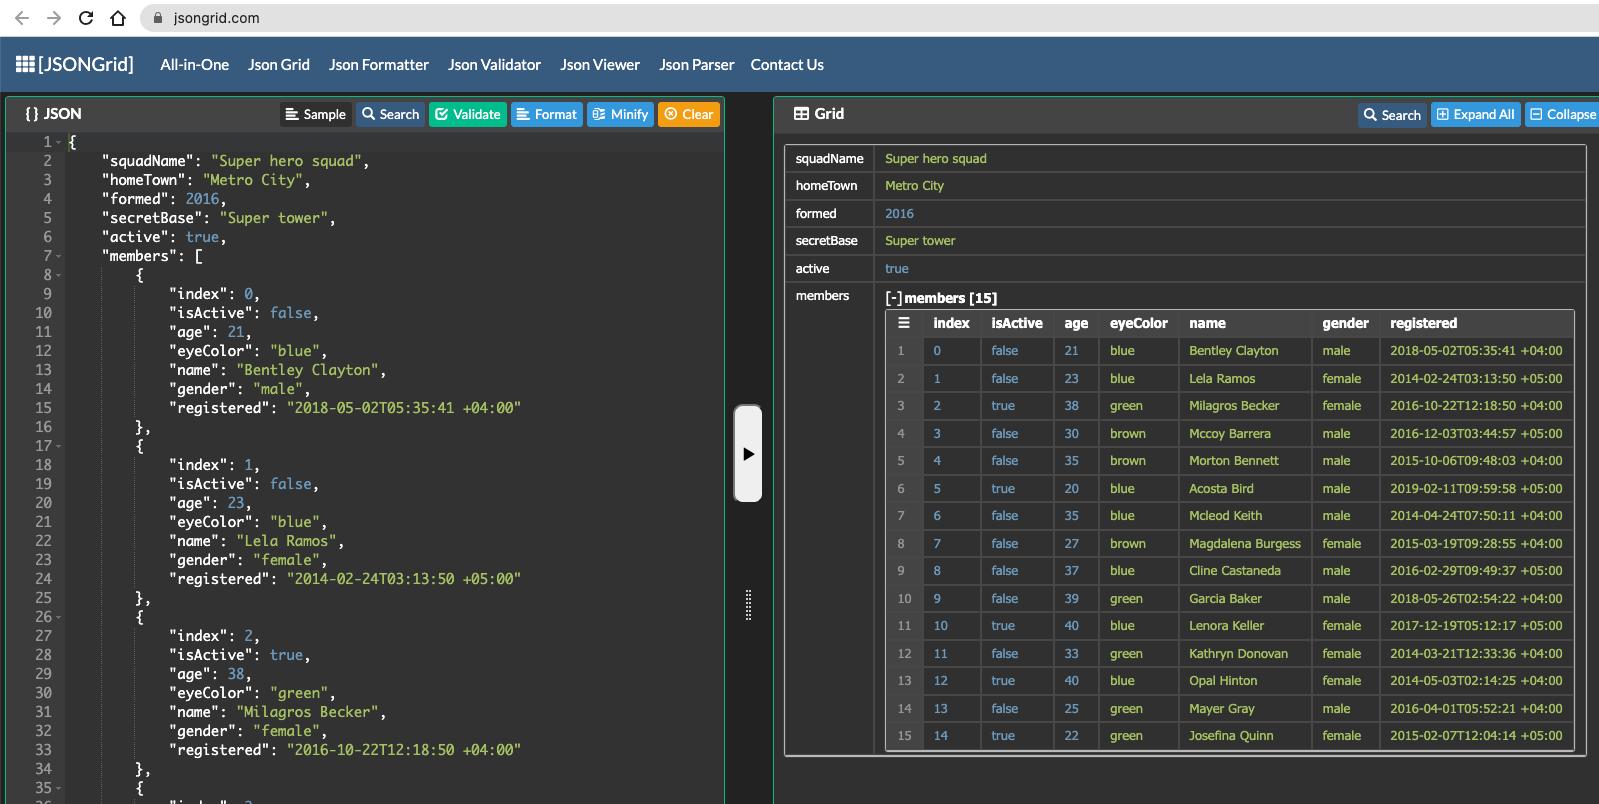
I’ve always liked Chris Nielsen’s JSON Visualization tool, which for a long time has been my go-to for JSON display, and for another long time it has been offline or non-reachable. Looking for it I also found JsonGrid, which follows pretty much the same logic.
It also happens that JsonGrid is a portable (and pre-packaged) open source library, available at GitHub. And it also turns out that the integration work is mostly 3 lines.
Integration
Add this into your “Tests” tab for a collection/folder/request and you’re good to go!
const template = `
    <link href="https://fonts.googleapis.com/css?family=Roboto+Mono:400,500,700&display=swap" rel="stylesheet">
    <link rel="stylesheet" href="https://unpkg.com/@araujoigor/json-grid/dist/json-grid.css">
    <script src="https://unpkg.com/@araujoigor/json-grid/dist/JSONGrid.min.js"></script>

    <div id="container"></div>
    <script>
        const data = ${responseBody};
        var container = document.getElementById("container");
        var jsonGrid = new JSONGrid(data, container);
        jsonGrid.render();
    </script>
`;

pm.visualizer.set(template);
From it, you’re free to add any styles that you’d like (I personally like to reduce the fonts a little bit), and you’re good to go!
Update 2023-07-19: Postman already provides a responseBody available variable that contains the response in text format, and JSonGrid can handle text types without issues at all. That means that we get simpler code and even non-JSON response parsing. How wonderful is that?